Biostrap Biometrics Deep Dive: Eye-Opening Measurement For Stellar Health Improvements
Hey again, thanks for reading my second installment in the 3-part series comparing the Fitbit and Biostrap.
But first, before diving deep into my own topic, I want to compliment David on the excellent review of the Biostrap and Biostrap EVO that he's already accomplished.
Please read both reviews if you're interested in the basics of how the Biostrap (code 10FERGUS saves 10%) works and what it can measure.
As stated, this is the third installment of this series. Here's an overview of what I'm trying to accomplish in this 3-part series:
- First, I've compared the basic features of the Biostrap and Fibit. You can read that article HERE.
- This installment, what you're reading right now, takes a real deep dive into the biometric measurements of the Biostrap. I'll also take a very deep dive onto how the Biostrap has helped me personally deal with health issues, and how all of the biometrics were applied to my unique health circumstances.
- The last and third installment reviews the Fitbit - here I also compare both devices one last time.
Ready?
Let's learn everything there is to learn about the different biometric measurements of the Biostrap, such as pulse, sleep quality, oxygen saturation, advanced reports on heart function, and much more:
Biostrap's Monthly Analysis Report
Consistently wearing my two trackers - the Biostrap and Fitbit - shows me how each new variable I'm testing out is impacting my health over the course of a month.
I didn't realize Biostrap would email me useful month-to-month comparisons of my data until receiving the first one.
Had I known this benefit was available, I would have waited until the first of February 2021 to start my experiment for the article on Xen by NeuvanaLife vagus nerve stimulation rather than beginning it on January 19th after a full month of collecting Biostrap data as a baseline.
This monthly overview is so valuable for giving us a big-picture perspective to know if we are on the right track or barking up the wrong tree.
As you can see in the image below comparing February's data to March:
- recovery score after a night's sleep jumped up from 53 to 70
- total sleep increased
- my circadian rhythm is more consistent
- heart rate variability improved
- my resting heart rate is lower
- oxygenation went up
- average steps/calories/duration/distance doubled
(*In the image below, pink bars represent March and purple is for February.)

Looks like I discovered something in March, especially those first 18 days, that helped me across the board.
It's one thing to speculate, "This new health habit seems to be working."
It's far more compelling to realize, "Everything improved! Some areas are even twice as good now!"
(*Spoiler alert: I think my April stats are on track to be even better than March as I continue using a new therapeutic device called Sensate that I'm experimenting with for an upcoming article.)
You know, the number on my scale didn't change from February to March and it seems like body weight is the main metric most people track.
If someone was only relying on body-weight data to evaluate if they were on the right track, it may look like their best efforts were in vain.
It is so empowering to see that a new strategy is making an appreciable difference over the course of a month which will certainly pay off big dividends over the long haul.
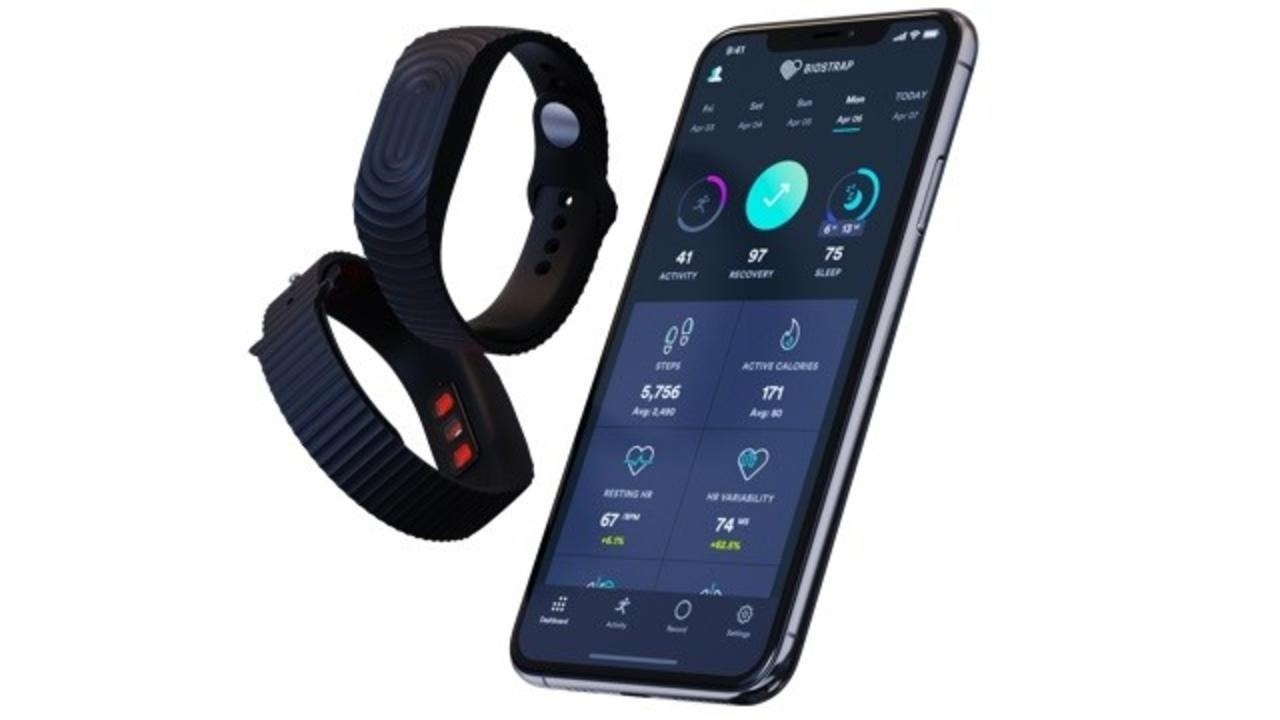
Biostrap's Home Screen on the App
It is so interesting to wake up to this page every morning. No two days are alike.
It's usually a mixed bag of different biomarkers being better or worse than usual. I often feel a jolt of excitement on the days when most markers are reflecting that whatever I'm doing is working.
Even on days when the news isn't so rosy, I'm sure I get a boost of dopamine waiting in suspense for the results to appear and contemplating what factors may have diminished my sleep.

Biostrap home screen
Exceptionally high scores cause the colorful circles to be filled in with color like shown above with my 97 sleep score filling in the circle blue. It's like an added gamification reward.
When it shows an improvement in contrast to the 30-day baseline, as you see in my heart rate variability improving 31%, that feels like beating your personal best.
It starts every day on the right note of reflecting on how my daily habits or temporary circumstances are influencing my wellness metrics as I consider how to do my best to choose wisely in the new day before me brimming with possibilities and potential.
As you can see below, I feel like celebrating when I see that small changes are resulting in major improvements. 
It's highly motivating to seize the day from the get go and make it a great one in hopes of getting terrific news tomorrow.
On the flip side, sometimes Biostrap has an alert for me that I didn't fully recharge my batteries overnight or sleep as well as I had hoped.
Though it's disappointing, that useful information helps me navigate the day when operating with less reserves.

Often, when met with discouragement, overwhelm or exhaustion later in the day, I am reminded that maybe I'm not running on a full tank of gas, so I shouldn't push the pedal to the metal.
Other times like today, I anticipate a low recovery score from staying up way past my bedtime and sleeping in excessively. Surprisingly, my recovery score was terrific. I know it's safe to push my limits more on these days.
(Granted, my circadian score today was only 7 out of 100, so it's not like my free-wheeling schedule escaped Biostrap's notice.)
Biostrap's Recovery Evaluation
Biostrap really outshines the free-subscription Fitbit in monitoring and evaluating how restorative my sleep was throughout the night.
At first glance, getting 8 hours of sleep looks perfect. Upon closer inspection, it is apparent that my heart was under stress and trudging along with low HRV like a marching soldier rather than having the spare reserves to dance to the beat of varying drummers with high HRV.

Noctural HRV readings: you'd never learn about this if you didn't actually measure these variables!
I like Biostrap's monthly overview below which shows:
- average recovery score for that month
- percentage of change compared to the previous month's score
- average total sleep
- average resting heart rate
- and graph of how every night that month stacked up in the grand scheme of things
 Biostrap's monthly overview explains a lot: energy, stress, health... Good to know!
Biostrap's Sleep Time
Rather than show you a monotonous stretch of monophasic sleep, I thought these isolated insomnia-influenced chunks of polyphasic-sleep were more useful showing how the data from each sleep segment is pieced together like a pretty patchwork quilt.
 The Biostrap registers how much time you're sleeping each night.
Biostrap's Sleep Overview
Ever had those night's when it you got plenty of sleep but still don't feel like you're running on all 8 cylinders?
Biostrap lets you subjectively rate how well you think you slept, how refreshed you feel, and what all the contributing factors were from their list of common variables, before showing you the objective data.
There isn't an option to customize the labels at this time. By adding the keyword label "sick," I can track if that issue is impacting my sleep.
(I was having symptoms from my casein-milk-protein allergy after eating dark chocolate that included dairy unbeknownst to me until it was too late.)
It really helps to keep track of multiple variables to be able to select pre-made labels to apply. It's easy to forget all the random variables that factor into the equation unless you have these little notes-to-self attached to the data.

Biostrap's Sleep Stages, Ideal Schedule and Sleep Bank
Above is the top part of one of my favorite screens. I am thankful that they do track the difference between light sleep compared to what they call deep sleep which also includes REM in their system.
I appreciate Biostrap's daily customized bedtime and wake-up recommendations below.
When you read articles on sleep advice, naturally it usually advises you to go to sleep earlier and stick to a consistent bedtime.
My application of that sleep advice was to pick an ideal bedtime like 10:00pm and then try to consistently stick to that time regardless of how badly my insomnia had messed up my plans.
After a week or so of getting a feel for your routine, Biostrap recommends this customized sleep window based on the previous week's times, I believe.
I can't tell you how many times I've thought it was just about my bedtime any minute now, then Biostrap would advise me, "Your recommended bedtime is coming up in 75 minutes at 11:50pm."
Me: "Oh! You don't say! Well, I've got better things to do than lay awake tossing and turning."
This has worked out so well for me. My sleep efficiency and consistency is the best it's ever been!

Biostrap's sleep bank accounting was quite a culture shock for me.
When I used to hear people complaining that they were so tired because they had only slept 4 or 5 hours the night before, I'd consider them lucky because I had often only slept between 30 minutes to 3 hours that same night.
Back when I did the experiment for the Qualia Night article in September of 2020, I was really pleased that it helped me sleep most nights in one long segment of 4 to 6 hours solid.
I felt like I had won the lottery if I got 7 or more hours of sleep during those three decades.
Biostrap customizes their sleep recommendation to our personal needs for that week based on our sleep data and recovery scores. As you can see above, it was recommending I get 8h 32m a night to fully recharge my batteries.
When I got six-and-a-half, it showed that I was 90 minutes in the red and felt like they were raining on my parade.
I didn't like being in the red and balked at their seemingly excessive amount of sleep advised.
I've learned to listen to Biostrap as my sleep keeps steadily improving!
Now, my personalized sleep recommendation says I only need 8h 27m of sleep a night. My sleep-time needs must decrease as my HRV increases.
I'm eager to get the next monthly email report to see if there have been additional improvements.
Biostrap Sleep Biometrics
I never cease to be intrigued by the graphs on this page. This info is invaluable for anyone battling insomnia, sleep apnea, or any other condition affecting the quality of their sleep.
Most surprisingly for me, in all my decades of insomnia, I never suspected that my oxygen levels were decreasing gradually during the night (first image) or rapidly without bouncing back (second image.)

Check out the rollercoaster ride on that HRV!
Nothing beats the play-by-play action of my heart-rate-variability graphs depicting the highs and lows of the entire night.
It's well worth the wait to get these eye-opening graphs every morning.
Sure, Fitbit's premium subscription offers an average HRV for the night. Granted, there seems to be strong agreement between Biostrap and Fitbit on my HRV average being better or worse than the previous night.
(By the way, if you're interested in the Biostra, click HERE and use code 10FERGUS to save 10%)
Albeit, their numbering systems are quite different. My Fitbit HRV score is consistently far lower. My Biostrap score is higher and has greater fluctuations from night to night.
Is it just me or does getting just the average nightly HRV feel like just reading the final score of a ball game? It's nowhere near as exciting and enlightening as seeing all the ups and downs along the way, right?
In the image below, you'll see my HRV dipped at the same time as my O2 tanked. By comparing it with the breathing rate graph, you will see that my low oxygen was not at all associated with reduced breaths per minute.
While my oxygen remained flat-lined in the red, my HRV suddenly shot up sky high in the middle of that lowered oxygen environment.
My HRV spiked from an all-night low of 27 to an all-night high of 149! (For reference, 20 to 200 is the full gamut of typical adult HRV.)
Now, I ask you, "Is there a relationship between those two graphs? Is that high HRV a marker of irregular heartbeats triggered by a heart trying to cope with ongoing diminished oxygen?"
It sure seems that way to me. Notice, that my heart didn't race.

By the looks of things, oxygen exchange ceased to be a priority after 5am.
There appears to be a correlation between the time it shows I went into some type of "deeper quality sleep," either REM or deep, and the onset of the drop in oxygen and HRV.
Then it looks like my HRV shot up around the same time as I reverted back to light sleep. The timeline is not quite detailed enough to say which came first.
I have a hunch that when my HRV went through the roof, there were some extra beats and skipped beats that averaged out to roughly the same resting heart rate.
Dollars to donuts, I bet my body responded to the erratic beats by entering a lighter stage of sleep.
In fact, it may have even woken me up there, but if I was still laying in bed trying to fall back asleep, both trackers often give me credit for light sleep even when just laying there awake and still.
Biostrap Sleep Lab
A paid subscription is available to add arm movement monitoring through the wrist tracker and leg restlessness detection with the foot-movement sensor sold separately. I don't have the shoe-pod sensor, but the arm movements tell the majority of the story in my mind.
In my case, the arm movements closely correlate with my waking moments during the night. With that predictability, I don't spend much time evaluating that graph.
There is also a monthly overview of how much arm movement was tracked during each night, so that is much more useful to me seeing the trends over time.
With the Sleep Lab subscription, it can also detect snoring levels. Ever so sensitive, it was quite a process of elimination over several nights to get a few nights of pure data because it picks up the sound of the air conditioning running, the white noise machine, my husband's breathing, and mine.
My husband slept on the couch a couple nights when he was sick with a cold, so I was able to get 2 or 3 nights of absolutely no other sounds to determine that snoring is not the cause of my low oxygen episodes during some nights.
After sharing my data with others, someone recommended I started taping my lips at night to be on the safe side. Alex has written a helpful article about that and other unconventional sleep tips. Personally, I use a tiny 2mm by 8mm or 1/16 by 1/4 inch vertical strip of tape across the center of my lips.
No more waking up thirsty during the night now. Before taping my lips, I used to drink about 30 ounces or 887mL of water throughout the night. Thanks to this new taping habit, it's only between 0–4oz or 0–118mL of water nightly now. (Added bonus: less bathroom breaks interrupting my sleep.)
Biostrap Extras: Population Overview Comparing Averages
If you're wondering what's "normal" to compare your data with that of other users, Biostrap offers that on their "Insights" page.
My graph showed that due to my long hours at my full-time desk job and then working as a freelance writer in my spare time, I am short on active minutes and much too sedentary for most of the day.
It's one of those things I assumed was true of this career compared to past jobs, but I had brushed it off as par for the course.
Seeing my graph was always lower in active minutes and often lower in steps compared to all other women using Biostrap was a real eye-opener.
At first, I told myself, "They must all be athletes using Biostrap to prepare for the Olympics, so I can't compete with that."
Pretty soon, I found myself jumping on the mini trampoline in my office for a couple minutes on each work break trying to compete with all those presumed Olympic athletes and feeling good about starting to close the gap.
Realistically, we're all just competing against our past selves to invest in our future selves. When I started using Fitbit, I served patients needing wheelchairs, many were children. I felt deep gratitude for being able to walk as I pushed their wheelchairs multiple times a day. I need to recapture that conviction to never take the gift of walking for granted.
In my past two weeks abstaining from Fitbit, and missing out on the cheers and taunts from those in our group challenges, my steps have been dangerously low.
 Biostrap comparison with the wider population of my age group
Switching gears now, trying to evaluate if my HRV data is in the norm, I've had three points of reference to determine the relative value of my scores.
Firstly, the HRV screen says between 20–200 is normal. In the course of my four months of Biostrap use, I've seen my nighttime values range from 15 to 200.
Second-to-last and lastly, this Insights screen below which shows my HRV in relation to all other female Biostrap users and the web-like graph showing that my HRV is on the high end and continues to climb thanks to the HRV-enhancing device called Sensate that I'm currently testing for an upcoming article.
Biostrap App Extras: Meditation
Its 38 meditation tracks are enjoyable. My favorite part is that they can be layered with music from other apps.
I like to mix the Biostrap arrangements on top of the 528Hz wavelengths layered with inspirational music in my free Solfeggio app as well as the surround-sound soothing music tracks on the Sensate device's app that I'm currently experimenting with and will be writing an article about soon.
Isn't it a bit much to have a cacophony of three different apps playing musical arrangements simultaneously while I meditate? I'm an outside the box kind of person who will cobble together eclectic solutions to meet my objectives.
By listening to ambient music from 3 tracks at once, to say nothing of the deep musical vibrations of the Sensate device I'm testing, it helps me hit the nail on the head and turn off my thoughts while meditating because there is such an ever-changing variety of pleasant sounds to attend to.
My thoughts are always vying for my attention, so the layers of interesting auditory stimulation keep distracting me to pay attention to them instead, which gets me closer to the goal of being present in the here and now rather than lost in thought 24/7.
I'll admit, if I can succeed in bringing my awareness to the present moment and let go of all my past and future thoughts and subsequent feelings for a short 15-minute meditation session, I sometimes fall asleep sitting up by the end of it because it's like a lullaby.

You'll notice that the titles of each track include emotionally-charged words like "Heaven's Gate," "All-Loving Angel," and "Astral Voices."
Titles that use words associated with specific religious or spiritual belief systems could make some users uncomfortable which negates the purpose of meditation, so I'll address that here.
To put those prospective users at ease, there is no religious content to the songs. For example, I'm listening to "All-Loving Angel" as I write this. It's simply a soprano soloist with a beautiful voice singing without any words.
This library of musical content is all simply icing on the cake that's added to the app and not part of the Biostrap-hardware purposes.
Many of the Biostrap meditation music tracks such as "Astral Voices" and "Deep Beneath the Dreaming" were created by Christopher Lloyd Clarke. He's an Australian composer of meditation music and practices Reiki.
In one of his YouTube videos you can see a mob of several kangaroos hopping single-file through his back yard as though about to play leapfrog. Reminds me of all the deer running wild in my neck-of-the-woods.
He also composed their "Ascension" track which is identical to the "Inspiration" track on my Solfeggio app.
All the music is very peaceful and uplifting, perfect for improving heart rate variability and lowering resting heart rate during a meditation session.
Meditation is just another brain state, like sleep, and Biostrap captures the evidence of its restorative influence on our parasympathetic nervous system.
Tracking this change in heart function and the parasympathetic nervous system is the foundational substance of what the tracker is designed to assist us with.
Biometrics using the meditation app of Biostrap
Biostrap is the best-in-class at measuring heart-rate variability because they give us all the intricate details and use powerful algorithms and revealing graphs to give you the all the raw data and analysis in their comprehensive pulse reports.
The meditation reports don't provide nearly as much insight at a 5-minute comprehensive pulse report, so I think that would be more useful for a 5-minute meditation session.
I think Biostrap simply offers this meditation feature for those who would like to meditate for longer than 5 minutes and want to see the impact of that session from beginning to end on heart rate and HRV.
Biostrap Pulse Recordings
Of all the things I love about my Biostrap tracker, the pulse analysis is far and away my favorite benefit.
If this one feature was the only thing Biostrap could do, and even if it took hours of waiting to get the report, it would be well worth the wait and the investment.
Red LED lights penetrate the back of my wrist and reveal enlightening information about my circulatory system that is worth it's weight in gold.
Take a look at these two screenshots of my pulse results taken while being perfectly still for 5 minutes. You can see from the first shot that my heart is struggling across the board and in the second image everything is coming up roses.

My biometrics comparison in these two overviews of the results shows a clear improvement, not only from one scan to the other, but also from one 30-day baseline to the next as a strong indication that the biohacking variable I am currently testing is having a positive impact:
- Oxygen saturation 93–96% vs. 95–102% (average 95% vs. 99%)
- Heart rate 63–86 vs. 44–78 bpm (average 70 vs. 60 bpm)
- Heart rate variability 23 vs. 98 milliseconds (30-day baseline 64 vs. 78 ms)
- Stress index ratio of high to low heart frequencies a high 1.4 vs. the low 0.3
 My new and improved HRV and stress index!
Biostrap Pulse Reports
What could be more deliciously suspenseful than taking a 5-minute comprehensive pulse recording and then waiting another 5 minutes for it to create this data-rich analysis report.
With experience, you learn to predict what the graphs will look like and it's a dopamine rush when the graph shows you're correct.
With this visual representation available just moments after the scan, it shows what you were feeling your heart do during those 5 minutes and trains you to understand what your heart is doing even at times when you can't take a scan.
In the beginning, I could only predict the irregular beats on the pink graph that dipped well below zero.
Now, I can anticipate what the stress-ratio index will be from the feel of my heartbeats before I see the bar graph of the three different wavelength ranges of beats.
Where the rubber meets the road is understanding what those sensations mean when I am on the job and noticing that a stressful situation has my heart feeling the way it does when the red low-frequency bar is high indicating stress.
This in-the-moment awareness helps me be mindful to try to turn things around through slow nasal breathing and reframing my assessment of the situation in less alarming self-talk.
Other times, it may not be related to an isolated event but a generalized stressed heart for hours during my shift from lack of sleep the night before. In those cases, I may consider other strategies such as laying down on my breaks or taking supplements that support my heart function.
Biostrap emails you these comprehensive pulse reports and you can view them in the app as well.
These reports are always chock full of insights. Here's one of my 5-minute pulse reports.
Page one shows:
- heart rate of 63 bpm with a 30-day average of 58 bpm
- heart rate variability of 75 milliseconds with a 72 ms 30-day average
- stress index ratio of low frequency to high frequency beats of 0.45 (0,45)
- PPG signal graphing 5 minutes in continuous 15-second increments
Page two has 5 graphs:
- time difference between beats over the course of 160 beats
- duration between two beats in relation to the previous interval
- total milliseconds spent in each frequency bandwidth assessing stress
- cardiovascular disease risk (flexibility vs. stiffness of arteries)
- peripheral arterial disease risk (smoothness vs. stickiness)
Page three gives us:
- artery age (39 years vs. my chronological age of 45 years)
- oxygen saturation (it was unable to get a reading this time)
- heart rate graph (flat rate with an isolated spike to 117 bpm)

Every report reveals different dynamics. Here's a second 5-minute comprehensive pulse report below for comparison to the first one above.
On page one of this second report, you can see:
- Average heart rate just one less beat.
- It captured my oxygen levels this time at 99% with a 96% 30-day average.
- lower 51milliseconds HRV and lower 30-day baseline of 64 ms
- lower stress index ratio of only 0.30 (0,30)
- very uniform PPG graph peaks vs. the wild variety of the PPG graph above
Page two shows these differences:
- the time between beats (uniform all around 1000ms/1 second)
- interval duration relation (beats all clustered together without strays)
- high vs. low-frequency ratio (milliseconds only in the hundreds vs. tens of thousands)
- cardiovascular disease risk (better score of 71.67 below vs. 60.47 above)
- peripheral arterial disease risk (better score of 71.77 below vs. 54.96 above)
Page three gives us additional distinctions:
- artery age (31-year old vs. 39 above vs. 45 my actual age)
- oxygen saturation (95–100% and 98% average)
- heart rate graph (rhythmic variation with one brief spike to 81 bpm)
 Another pulse report
It's a challenge to unravel all the mysteries of interpreting these comprehensive pulse reports.
Information on interpretation of the report is hard to come by. I finally stumbled upon one article in the middle of the FAQ section of the app four months later.
It gave an ultra high-level overview of the report's sections, which may suffice for many users, but barely scratched the surface of all my questions.
I yearn to plumb the depths of the meaning of these graphs. I would settle for just the nitty-gritty details like a label on the y-axis of the PPG graph, which I can only assume is the number of milliseconds, but there's no telling.
My Biostrap Beginnings
I was freaking out my first month with this tracker, seeing that even my "good days" were riddled with ridiculously rogue beats.
At first, I'm sure I annoyed the heck out of my AlexFergus.com teammates by posting oodles of questions and screenshots, hoping the three other Biostrap users could shed some light on my plight.
Next, I dove into the online vortex of PPG articles and videos featuring engineers and research scientists who had each devised a different system with different ways of graphing the data as if each company had its own secret code and despite seeing patterns and parallels, answers eluded me.
Logically, the next stop was devouring clinical research articles. As you can imagine, they addressed all manner of cardiologist-managed diseases, so it was unsettling, to say the least, wondering what a cardiologist would say about my stray beats.
Next up, YouTube videos of cardiologists discussing different types of heart arrhythmias became a source of guidance.
That turned into a Google search about atrial fibrillation and associated risks, which made me queasy.
At that point, I called my mom, who used to be a registered nurse, and discussed my concerns with her.
Next stop: my doctor's office. I genuinely like my knowledgeable and thoughtful primary care doctor. Naturally, the conversation revolved around the dreaded traditional treatment options available to me on the horizon should the need arise.
Ultimately, I had to satisfy my curiosity about these comprehensive pulse reports the hard way: by taking countless scans and comparing the graphs to my subjective sensations.
Utilizing Biostrap's Pulse Report
Note: the next section will be a bit technical, explaining the outcomes in the pulse report graphs I've listed above. If you don't like the technical explanation, skip ahead to the next section.
Those pink zig-zags of the PPG graphs at the beginning are interesting but tricky to pin down. Funky-feeling beats make it look irregular. Sometimes even if it doesn't feel off, it looks off.
Those erratic zig-zags are tightly correlated with a younger artery age, as young as 2-years old on one of my Biostrap Pulse Reports.
Uniform-looking ups and downs on those pink lines often correspond to a higher artery age, as high as 56 one time.
Standing still makes the pink lines more likely to be erratic, as does sitting. Laying down gives it a better chance of being symmetrical.
Erratic ups and downs are more closely associated with higher HRV than the even-keeled ones, but not nearly as much as I initially expected.
The y-axis numbering system changes in scale to get the best graph of the pink lines. Sometimes the highest number is 900 and other times 6,000.
What the zero line means is anyone's guess. It changes in position in relation to the depth of my sub-zero beats. Sometimes the zero line is in the middle and other times it's down at the bottom of the other lines. It may even be different from line to line within the same report.
When my heart feels like it's beating consistently but just seems to be struggling and feeling fatigued and squeezed, the red bar of low-frequency beats is usually high compared to the blue and yellow bars. After even low-intensity exercise, the red bar is highest.
When low-frequency red is highest and blue and yellow are lower, my heart feels under strain maybe not always in those moments, but at least within the preceding hour.
Wrap your mind around this riddle: all three frequency bands can be bottomed out or all sky high. What's that about?
Stranger still, the blue ultra-low frequency and yellow high-frequency bars can be maxed out while the red low-frequency bar is low and the reverse can be true too.
If red correlates with stress as much as it seems to, you'd think the blue bar would be indicative of extreme stress, right? Get this, a history of extreme stress can actually suppress the blue bass beats. I'm dead serious.
It's clearly not a progressive linear relationship between these three independent frequency bands as I had initially predicted.
The wild-card blue bar marches to the beat of its own subwoofer. It can vacillate between being on par with either the yellow or red bar or be above or below the others.
When deep blue is highest, it feels like my heart is visibly thumping like an old-school cartoon character in love.
Oddly enough, the heart can cycle in and out of these bass beats in 5-minute cycles. I'm envisioning the exponential effects of resonance where the difference may be slow and deep, like binaural beats.
Most commonly, my heart's tweeter generates high-frequency yellow with less red and blue. That pattern fades into the background of normalcy. Heavy on the red and blue simultaneously feels the worst, especially if yellow is scarce.
Scatter point graphs are just fun to look at, but that first one in the report is an excellent visual of how steady or erratic the beats are.
There's a fine line between the points all lining up on the 1,000ms/1sec line/60bpm perfectly spaced, as predictable as a metronome or the seconds' hand of a wall clock.
On the other end of the spectrum, when every beat is erratic, those points are all over the board, as if social distancing.
The happy medium seems to be a little breathing room between them as they all gather near the 1K-milliseconds line.
Nothing is more mysteriously mesmerizing in measuring the meaning of HRV than the Poincaré Plot. This French mathematician's graph is like a beautiful language that I don't yet understand.
Teasing out the truths of its elusive secrets will be my tireless quest till my sleeves are stained red from all the blood, sweat and tears. In what hypothetical scenario is that plausible?
Well, say it's during the heat of the summer at my annual physical and I endure a tear-jerker botched blood draw whereby the gripping lab results strengthen my grasp of the graph. It could happen.
Providentially, I stumbled upon an explanation that makes my intuitive heart sing from discovering there is an elegant pattern underpinning the graph's fulcrum resulting in various distinct geometric shapes to the scatter points distinguishing healthy heart rhythms from a plethora of arrhythmias.
"Results: Poincaré plot representation of RR interval data revealed a wide variety of visual patterns: (i) comet-shaped for sinus rhythm; (ii) torpedo-shaped for sinus bradycardia; (iii) cigarette-shaped for sinus tachycardia; (iv) butterfly-shaped for sinus tachycardia and isolated atrial premature complexes; (v) arrow-shaped for isolated premature complexes and inappropriate sinus tachycardia; (vi) inverted fan-shaped for sinus rhythm with frequent atrial premature complexes; (vii) tornado-shaped for atrial flutter and atrial tachycardia; and (viii) fan-shaped for atrial fibrillation."
It's all terribly intriguing as I seek to steer my heart functioning in the right direction, if at all humanly possible, and I believe it is, through this enlightening invention, Biostrap.
Here's the bottom line of what I discovered: The very bottom line of the 3-page report is the most useful at-a-glance graph for evaluating my heart function.
Under stress or short on sleep, that graph is flat-out flat-lined with mountain peaks of rapid beats and canyons of beats delayed.
On the best days of ideal sleep and inner-peace, that heart-rate graph looks like a serrated blade's edge, or if that's too edgy, then like a strand of cashmere yarn zig-zagging across a sweater with tons of tiny ups and downs without any misplaced or dropped stitches.
I'll give you the most precise analogy I can come up with: We just spent an arm and a leg on new central heating and air conditioning units for both inside and outside our home. The new thermostat is fancy as all-get-out.
As expected, this hefty investment in all new equipment keeps our home in a comfortable climate-controlled zone within 3-degrees Fahrenheit. The house warms 3 degrees, the air-con drops it by 3 again, up and down, 24/7.
That's what the graph looks like on my good days: rapidly fluctuating ups and downs in symmetrical increments.
The old system was replaced for a reason. On rough-rhythm days, my heart is like that struggling outdoor AC unit from 1979 we just now replaced. My irreplaceable heart's a few years older. I want my body to far outlast every appliance, device, and vehicle I'll ever own.
Like our former indoor AC unit, my heart also had drippy ductwork requiring heart surgery on my ductus arteriosus when I was mature enough to survive it at 13-months-old. Had I been born a decade earlier, it wouldn't have been possible to do heart surgery on me as a toddler.
When the old thermostat turned on the heat, it didn't know when to quit, like a heart rate that spikes too high for no good reason. Conversely, when it started the cold air, it ran too long, just like a snail's-pace heart-rate.
The flat lines on the graph are like that old thermostat being under-responsive which is a bit like low heart-rate variability, just barely getting by.
As you can imagine, an unregulated thermostat doesn't create a comfortable environment, and neither does a poorly controlled heart rate.
What is it that controls your heart rate like a thermostat? The sinus node spark plug igniting each beat? I used to think so. Now, I view that sinus node that is generating electrical signals more like the electricity flowing to the indoor and outdoor air-conditioning machines.
The truth is, the thermostat regulating your heart rate is your autonomic nervous system operating on auto-pilot even while you sleep to orchestrate those beats through the different stages of sleep.
That's fantastic news from my perspective because you can dial in the functioning of your autonomic nervous system.
My Life Before Biostrap
People who have uncontrolled heartbeats resulting in wompy-jawed rhythms such as atrial fibrillation are often advised to have cardiac ablation surgery.
I've always assumed that was on my horizon because it's the long-term solution. Although, it's not always a permanent solution because extra electrical tissue can grow back to replace the previously zapped tissue.
The short-term heat-of-the-moment solution is to have the heart stopped for a few seconds in the hospital's emergency room with an intravenous drug that momentarily paralyzes the heart or else by sedation and electric shock.
When the heart resumes beating spontaneously after those dramatic medical interventions, it usually resets back to normal sinus rhythm. These treatments may need to be repeated regularly as needed.
That's the solution my cardiologist offered me two decades ago in my mid-20s. I've been a biohacker ever since then by doing everything in my power to help my heart so that, by the grace of God, emergency-room heroics won't ever be necessary.
Biostrap (code 10FERGUS saves 10% on that website!) is helping me succeed in my quest by giving me an inside look at the workings of my heart so that I can assess the effectiveness of different strategies.
What could possibly help promote regular rhythms? The thermostat-like, autonomic, parasympathetic nervous system's vagus nerve is one of the key heartbeat regulators.
Non-invasive transdermal stimulation has been the ticket to support my vagus nerve functioning. I experimented with using Xen a few months ago, and I'm currently testing Sensate. These two remarkable devices have resulted in marked improvements in my biometrics objectively seen in my Biostrap pulse reports.
I wouldn't be here today if I hadn't had heart surgery as a baby. If my heart ever needs hospital heroics on the distant horizon, I'll be ever so grateful for the help to save my life.
In the interim, I am thankful that Biostrap is helping me monitor my heart health to evaluate the effects on my heart of variables like sleep, nutrition, vagus nerve stimulation, stress reduction, hormone fluctuations, and blood-sugar regulation.
Who am I to think I can track the way different factors influence my heart function?
I'm the same person as I was in my mid-20s when I spent weeks compiling a list of correlating variables that corresponded to my bad-heart days for my appointment with the cardiologist.
It was a succinct list of about 25 variables that I wrote on a sheet of paper and attempted to read to my cardiologist two decades ago.
The cardiologist grabbed the paper out of my hand after I read the first 5 to 10 factors. They glanced at the rest of the list for 5 to 10 seconds and handed it back—end of discussion.
I owe my life to the cardiologist who patched me up as a baby. As a result, I hold cardiologists in the highest regard.
As a young wife and mother, my husband and I were terrified that these heart arrhythmias would leave him a widower to care for our young children.
Realizing the cardiologist didn't care about why my heart was struggling with arrhythmias was the catalyst that motivated me to take care of myself.
The cardiologist told me to go to the ER to have my heart stopped and restarted as often as needed. I responded that I couldn't afford an ER visit 2 to 3 times a week. The cardiologist didn't say anything, but the glazed look on their face communicated, "Not my circus. Not my monkeys."
I went into that appointment hoping for a hero to rescue me. I walked out paper-in-hand with the chilling realization that I needed to learn how to influence all the variables on that list to save myself.
Biostrap helps me do that exponentially more effectively than ever before.
Finishing Thoughts: How To Use Biostrap Biometrics For Stellar Health
My heart has been high maintenance since birth. I had an echocardiogram scan as a 6-day old and another as an adult along with a battery of other testing including a 24-hour Holter-monitor, a chest x-ray, electrocardiograms, and a treadmill stress test.
The information I received from those tests was useful for the cardiologist in determining that I did not need any surgical interventions at the time.
None of it was particularly useful in helping me manage my condition. For example, I was informed that the walls of my heart squeezed so hard that they touched each other during the treadmill test which was one abnormal finding.
It just left me to avoid running since I wasn't given any advice on how to keep that from happening.
Disease-management tests are very expensive, even with insurance.
Obviously, I cannot elect to have tests run, nor have I requested any. It's on a need-to-know basis only when surgical interventions are being contemplated.
By default, that leaves me in the dark for decades at a time.
Imagine trying to manage diabetes and only having fasting glucose levels monitored every other decade.
You can't manage what you don't monitor.
Biostrap helps me measure, up to 20 times a day, exactly how my heart is beating, down to the milliseconds, with pulse-report data analyzed across multiple graphs, empowering me to make wise lifestyle choices to invest in its optimal functioning.
By running the comprehensive pulse report:
- It shows how a poor night's sleep affects my HRV and stress-band frequencies the next day.
- I can see that a customer's brief outburst messed with my heart for the next 30 hours.
- Using a device to support HRV improves my heart function in as little as 10 minutes.
- Thinking about something heartbreaking at some point during the 5-minute scan can show up as an objectively visible change on the graph within seconds of having those thoughts and feelings.
- When I count my blessings, remember the good times, and take a hopeful perspective of the future, it results in noticeable improvements in the graphs within 10 minutes.
If the Comprehensive Pulse Reports were the only feature of Biostrap, it would be enough for me to justify the financial investment as highly valuable to me personally.
Amazingly, it is also tracking my biometrics like HRV compared to oxygen saturation and other graphed variables even while I'm asleep and can't run a 5-minute scan.
Biostrap be like, "We got you, girl. Sleep like a baby. We'll fill you in later on what your heart was doing during the night."
If I never saw another weather report the rest of my life, no sweat. My life doesn't hang in the balance of that forecast.
The quality and length of my life depend on understanding the impacts my decisions have on my physiology so that I can choose wisely for my well-being.
I will be a loyal customer for life, wearing my tracker while dancing at my 100th birthday party with a happy heart.
Items Mentioned:
- Biostrap - use code 10FERGUS to save 10%
- Oura Ring
- Qualia Night - discount code FERGUS saves 15%
If You Found This Article Interesting, You Might Also Like:
- 100%-Free Home Workout Program: Leaner, Stronger, Healthier In Minutes Per Day
- How To Eat Healthy On A Budget: 22 Useful Tips
- The Importance Of Feedback For Improving Sleep, Health & Performance
- Important: Why You Need To Measure Your Body Temperature
- LetsGetChecked Review: Health Testing From The Comfort Of Your Home
- Skulpt AIM & Chisel - I Review 9 Months Of Use And Test How Accurate It Is Against a DEXA Scan [Updated with Chisel]
This article was written by Christa Rucker. Christa has been biohacking her own physiology for two decades now. She loves to geek-out on researching scientific studies that connect different habits to measurable health outcomes. She also has extensive clinical experience assisting patients which has fueled her passion for prevention.
Get FREE Updates & EXCLUSIVE Content
Join Over 30,000+ Subscribers!


Join 10,000's of others and receive exclusive news and updates!

Looking For The Best Red Light Panels?
I've studied the science and tested the panels and put together this Red Light Therapy Resource & Deals Page